As indicated in my previous post, I am going to analyse a tidy tuesday dataset for this blog post. I will be using the R programming language and the excellent series of packages called the tidyverse.
This week’s tidy tuesday dataset is about anime, and comes from MyAnimeList.net. I find this especially exciting since I have enjoyed quite a bit of anime in my life - much to the dismay of my girlfriend. However I am sure I will be able to find an anime series to win her over - at least to some extent! Hopefully this dataset will be able to help! At the very least I should be able to see where my favourite series rank.
Loading the Data
The dataset can be found on the tidy tuesday github account.
Let’s begin by loading the tidyverse packages and doing some basic setup.
# setup

library(tidyverse)       # loads all the tidyverse packages
library(here)            # helps with path management

theme_set(theme_light()) # nice white and minimal theme for plots
Now we can download the dataset from the mentioned github account.
If you read their readme - you will find some handy instructions to download and import the dataset directly into R. However I am going to modify these instructions a bit since I am concerned about the dataset’s size. The below code will ensure the dataset is only downloaded once, instead of downloading it every time you rerun the analysis.
# Data Paths

data_url <- "https://raw.githubusercontent.com/rfordatascience/tidytuesday/master/data/2019/2019-04-23/tidy_anime.csv"

data_path <- here("content/post/data", "tidy_anime.rds")

# Check if Data has already been downloaded

if (!(file.exists(data_path))) {

  # Download Data
  tidy_anime_raw <- readr::read_csv(data_url, col_types = cols())

  # Save Data
  write_rds(tidy_anime_raw, data_path)

} else {

  # Read data since already downloaded
  tidy_anime_raw <- read_rds(data_path)

}
Next I do some basic data cleaning. I prefer the english_title given for each anime, but unfortunately it is not always available. So I create a new title column that uses it when possible.
tidy_anime <- tidy_anime_raw %>%
  mutate(title = ifelse(is.na(title_english), name, title_english))
Now we are ready to start answering some basic questions!
Which anime has the highest ratings?
I would like to know which anime has the highest scores on the website.
The rank column in the dataset can be used for this, since it ranks the anime according to the average score on the website. Other columns that will be useful are the score column which gives the average community score from 1 to 10, and the scored_by column which shows the number of users that have scored the anime.
First let’s look of an example of a well known anime like ‘Naruto’.
tidy_anime %>%
  filter(title_english == "Naruto") %>%
  select(animeID, title, rank, score, scored_by, genre) %>%
  slice(1:10) %>%
knitr::kable()| animeID | title | rank | score | scored_by | genre |
|---|---|---|---|---|---|
| 20 | Naruto | 705 | 7.9 | 716412 | Action |
| 20 | Naruto | 705 | 7.9 | 716412 | Adventure |
| 20 | Naruto | 705 | 7.9 | 716412 | Comedy |
| 20 | Naruto | 705 | 7.9 | 716412 | Super Power |
| 20 | Naruto | 705 | 7.9 | 716412 | Martial Arts |
| 20 | Naruto | 705 | 7.9 | 716412 | Shounen |
| 20 | Naruto | 705 | 7.9 | 716412 | Action |
| 20 | Naruto | 705 | 7.9 | 716412 | Adventure |
| 20 | Naruto | 705 | 7.9 | 716412 | Comedy |
| 20 | Naruto | 705 | 7.9 | 716412 | Super Power |
The anime’s ranks and scores are duplicated for every genre. This is because the dataset is in a long tidy format, with every column representing a variable and every row an observation.
Since we are only interested in the anime scores at this stage, I will create a simplified dataset that only extracts the columns related to score and popularity and selects the unique rows.
anime_scores <- tidy_anime %>%
  select(animeID, title, popularity, rank, score, scored_by, favorites, members) %>%
  distinct()

anime_scores %>%
  arrange(rank) %>%
  slice(1:20) %>%
  ggplot(aes(reorder(title, score), score, colour = title, size = log(scored_by))) +
  geom_point(show.legend = F) +
  coord_flip() +
  labs(title = "Top 20 Anime By Score on MyAnimeList.net",
       subtitle = "Size of dots indicate the credibility of an anime score",
       x = "",
       y = "Score (1 To 10)")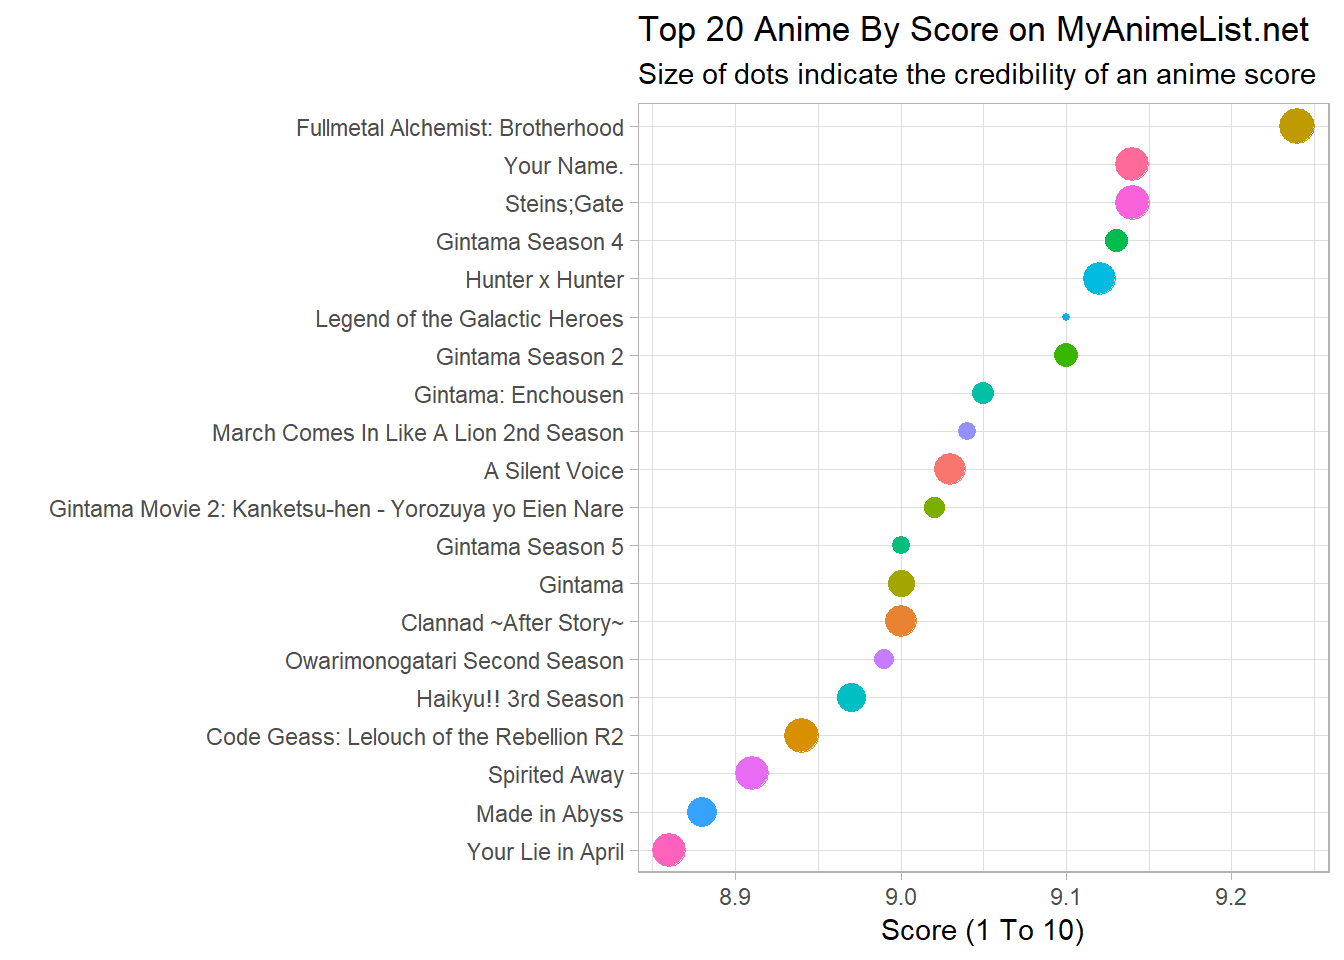
The graph already gives us a good overview of the highest rated anime series. Full metal alchemist: brotherhood is the clear favourite! Funnily enough even Elon Musk’s twitter profile is giving homage to the series, with his profile picture being a picture of the main character.

One issue I do see with the graph is that some anime have been listed multiple times (e.g. Gintama). This seems to be caused by the different seasons having separate ratings.
To identify and link different seasons of anime could become a bit tricky, so we won’t focus on it at this stage.
Which anime is most popular?
First I will use the popularity column to identify the 20 most popular anime.
anime_scores %>%
  arrange(popularity) %>%
  slice(1:20) %>%
  ggplot(aes(reorder(title, -popularity), members, fill = title)) +
  geom_col(show.legend = F) +
  coord_flip() +
  labs(title = "Top 20 Anime By Popularity on MyAnimeList.net",
       x = "",
       y = "Number of Members with anime in their list")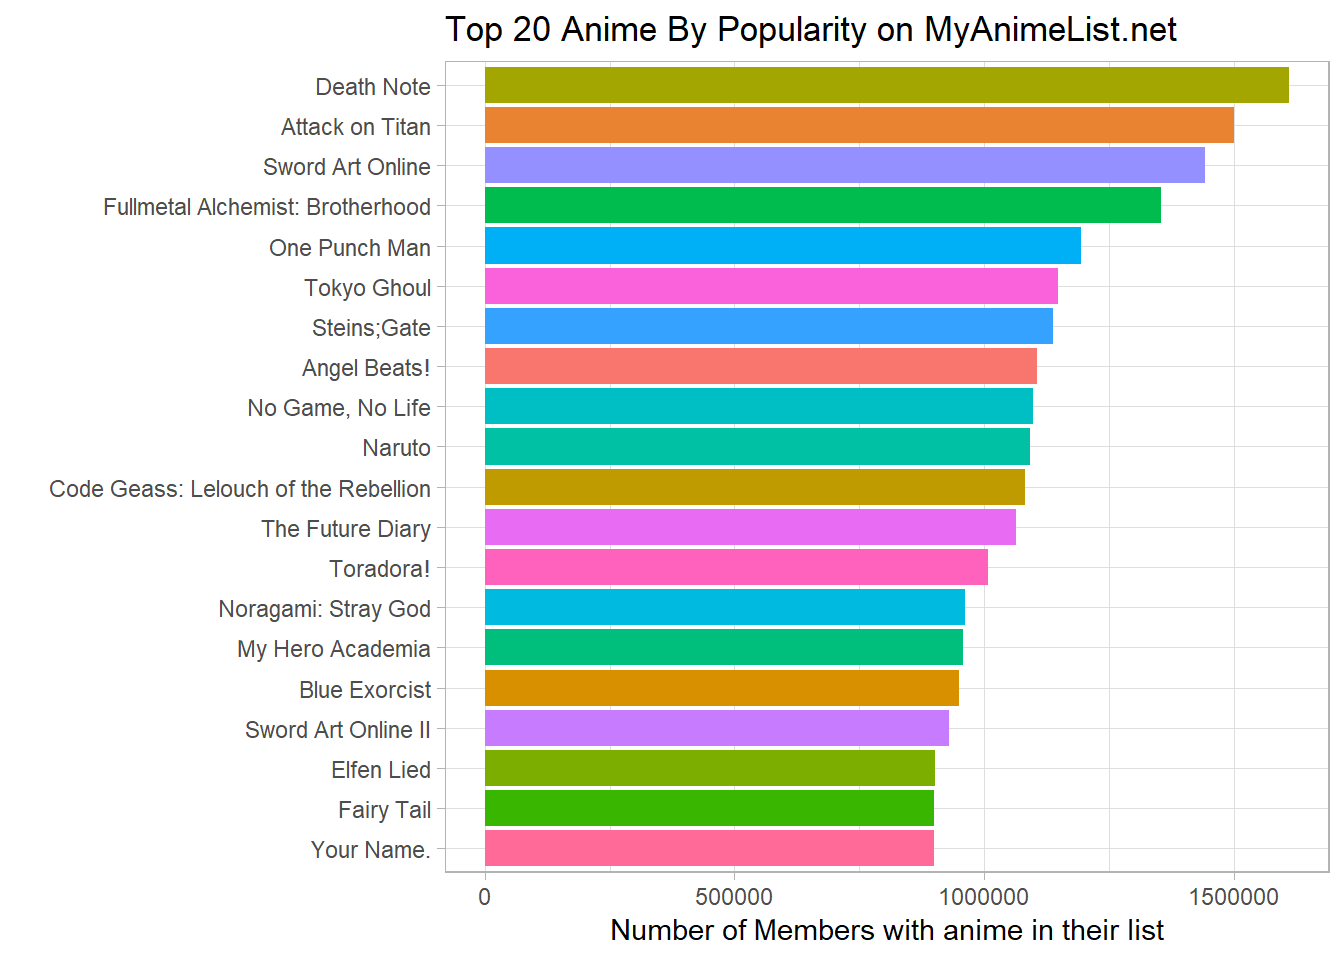
Death Note and Attack on Titan are clear winners, and both were really good series in my opinion.
Full metal Alchemist: Brotherhood also scores quite high in popularity.
I am a bit surprised about Sword Art Online scoring so high in the above list. However it did have a novel plot line, especially in the first half of season one.
Lastly I would expect Code Geass, Steinsgate and One Punch man to be here as well. They were really well rounded series, with really interesting plots.
Which popular anime also have high ratings?
This is an attempt to show both popularity and score on one graph. Instead of just focusing on the top 20 anime, lets expand it to top 50.
anime_scores %>%
  filter(popularity <= 50) %>%
  mutate(title = str_replace(title, "Code Geass: Lelouch of the Rebellion", "Code Geass")) %>%
  ggplot(aes(score, scored_by, colour = title)) +
  geom_point() +
  geom_text(aes(label = title, ), check_overlap = T, show.legend = F, size = 3, hjust = 1) +
  xlim(c(6, 10)) +
  labs(title = "Which popular anime also score high?",
       subtitle = "Top 50 anime shown based on popularity",
       y = "Number of users that scored",
       x = "Score (1-10)") +
  theme(legend.position = 'none')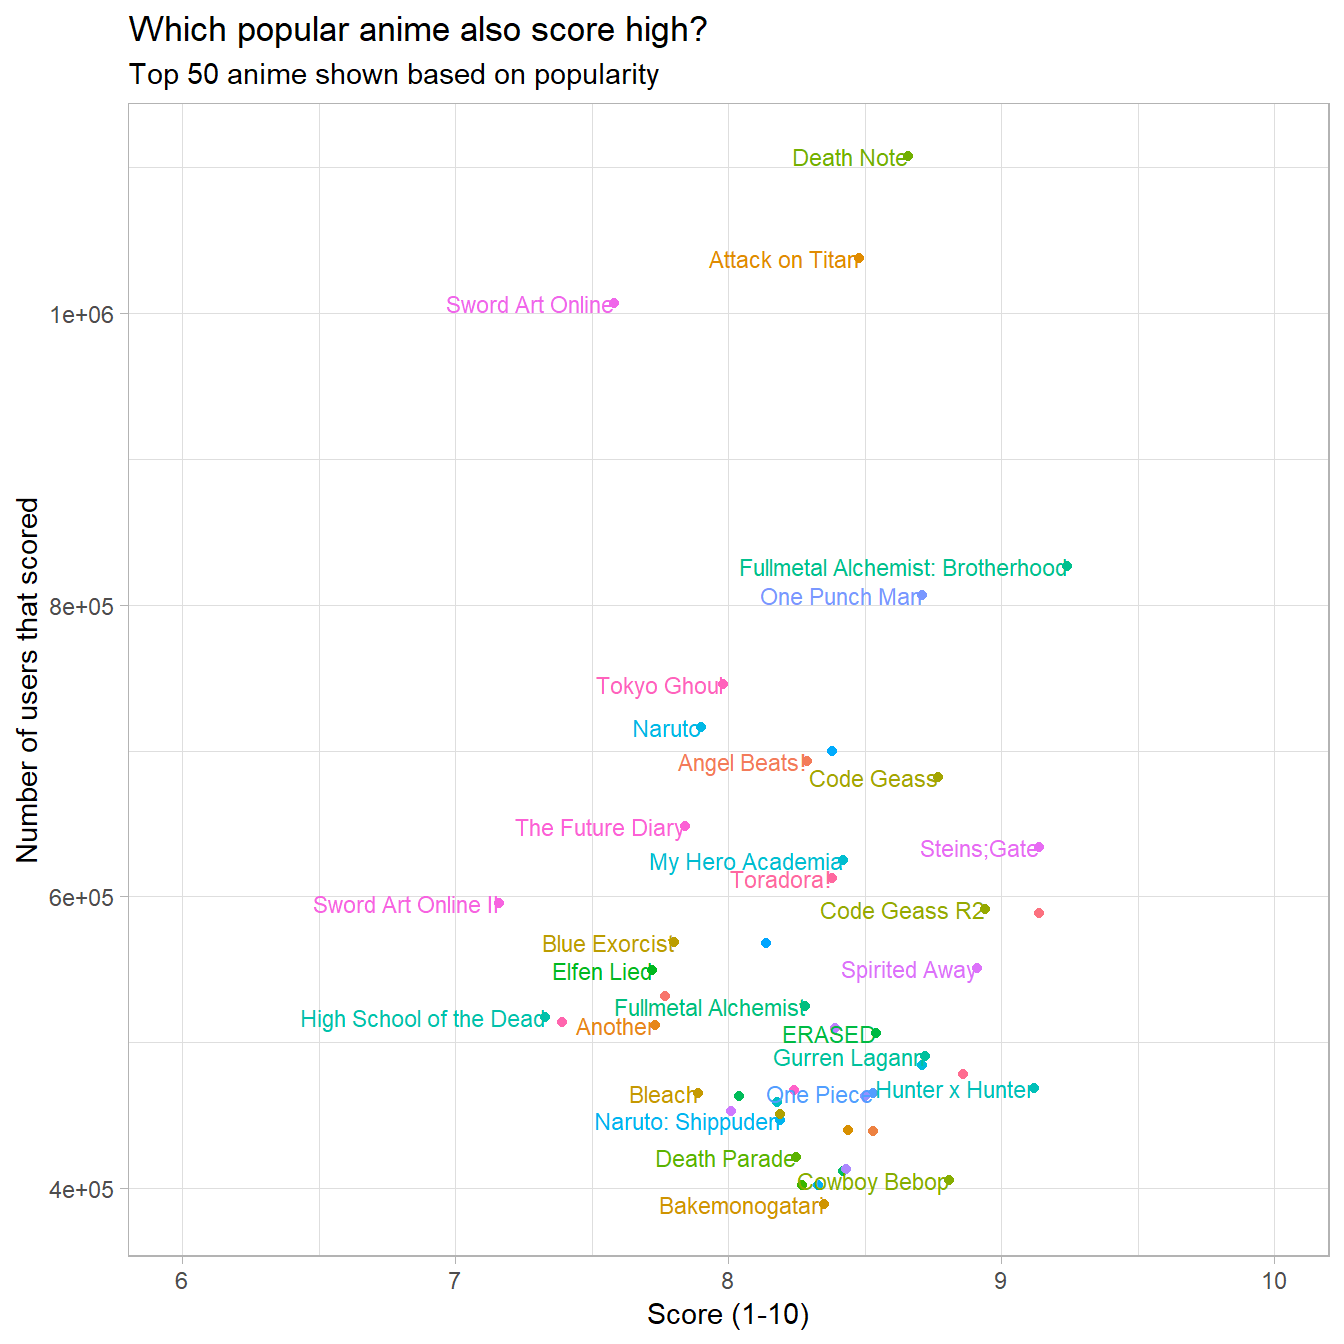
This gives a nice high level view of the popularity of the anime compared to the quality (or score).
We can also see the three Shonen jump series (Naruto, One Piece and Bleach), all with a score of around 8, with Naruto clearly being the most popular of the three.
It is also quite clear that Death Note, Attack on Titan and Sword Art Online has much higher popularity than the rest.
Overall Full Metal Alchemist and One Punch man seem to strike a sweet spot in terms of popularity and quality. Death Note and Attack on Titan are also not far behind them.
The bad
In the above sections we were only looking at the well known and highly rated anime. It would be interesting to look at the other side of the distribution. Particularly I would like to see if there are any of the names I recognise.
Maybe Neo Yokio from Netflix will be on here.
anime_scores %>%
  filter(members >= 100) %>%
  top_n(-20, score) %>%
  ggplot(aes(reorder(title, -score), score, fill = title)) +
  geom_col() +
  coord_flip() +
  labs(title = "Which anime was really bad?",
       subtitle = "Worst 20 anime with at least 100 scores",
       y = "Score (1-10)",
       x = "") +
  expand_limits(x = c(1,5)) +
  theme(legend.position = 'none')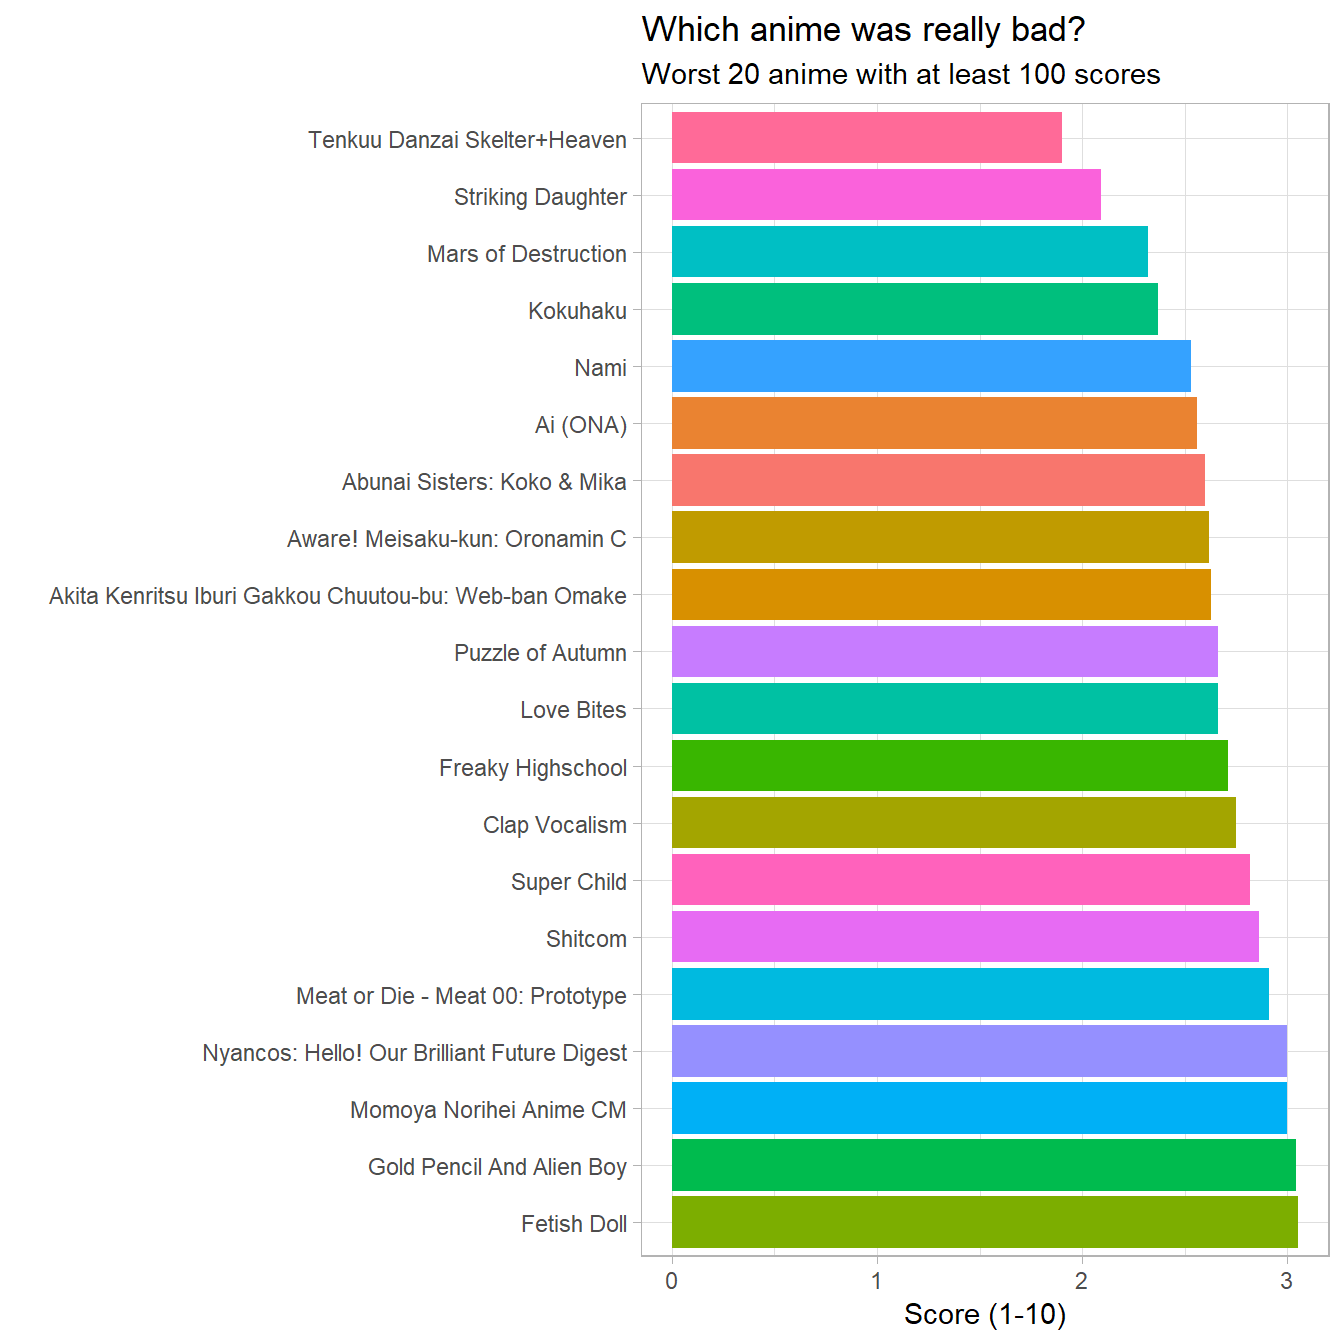
Unfortunately (or perhaps fortunately) I don’t recognise any of the anime names. Also I checked and Neo Yokio is not in the dataset at all. However I must say that there are a few names here that sound dodgy right off the bat. Examples include: Striking Daughter, Meat or Die, Fetish Doll and Shitcom.
Here is the synopsis of Striking Daughter:
tidy_anime %>%
  filter(str_detect(title, c("Striking Daughter"))) %>%
  pull(synopsis) %>%
  .[[1]]
## [1] "Sayuri is a curious creature who lives on her husband with her equally surreal mother and father. With an antenna-like whip protruding from her head, she is a striking daughter, and her long-awaited time to strike has come. Her family and friends watch eagerly as Sayuri carries out this bizarre ceremony. [Written by MAL Rewrite]"Doesn’t exactly sound riveting, but at least not disturbing. I will spare you the more disturbing descriptions.
The Red Turtle
So even after going through this whole exercise, I still haven’t found an anime that my girlfriend will enjoy! I tried selling her on the plot lines of the highest rated anime I found in the previous section, but without much success. At least she did admit that the Death Note plot line sounded dark, but interesting. However I am still looking for something better.
Luckily she gave me a good starting point when she mentioned that the one anime she has seen and really enjoyed was ‘The Red turtle’ by Studio Gibli. Even though it is not in this dataset, at least the producer of this anime is in here. Lets see if they made any other highly rated anime.
tidy_anime %>%
  filter(str_detect(studio, "Studio Ghibli")) %>%
  select(-genre, -type, -producers) %>%
  distinct() %>%
  filter(score > 8) %>%
  ggplot(aes(reorder(title, score), score, colour = title, size = log(scored_by))) +
  geom_point(show.legend = F) +
  coord_flip() +
  labs(title = "Highest Scored Anime From Studio Ghibli",
       subtitle = "Size of dots indicate the credibility of an anime score",
       x = "",
       y = "Score (1 To 10)")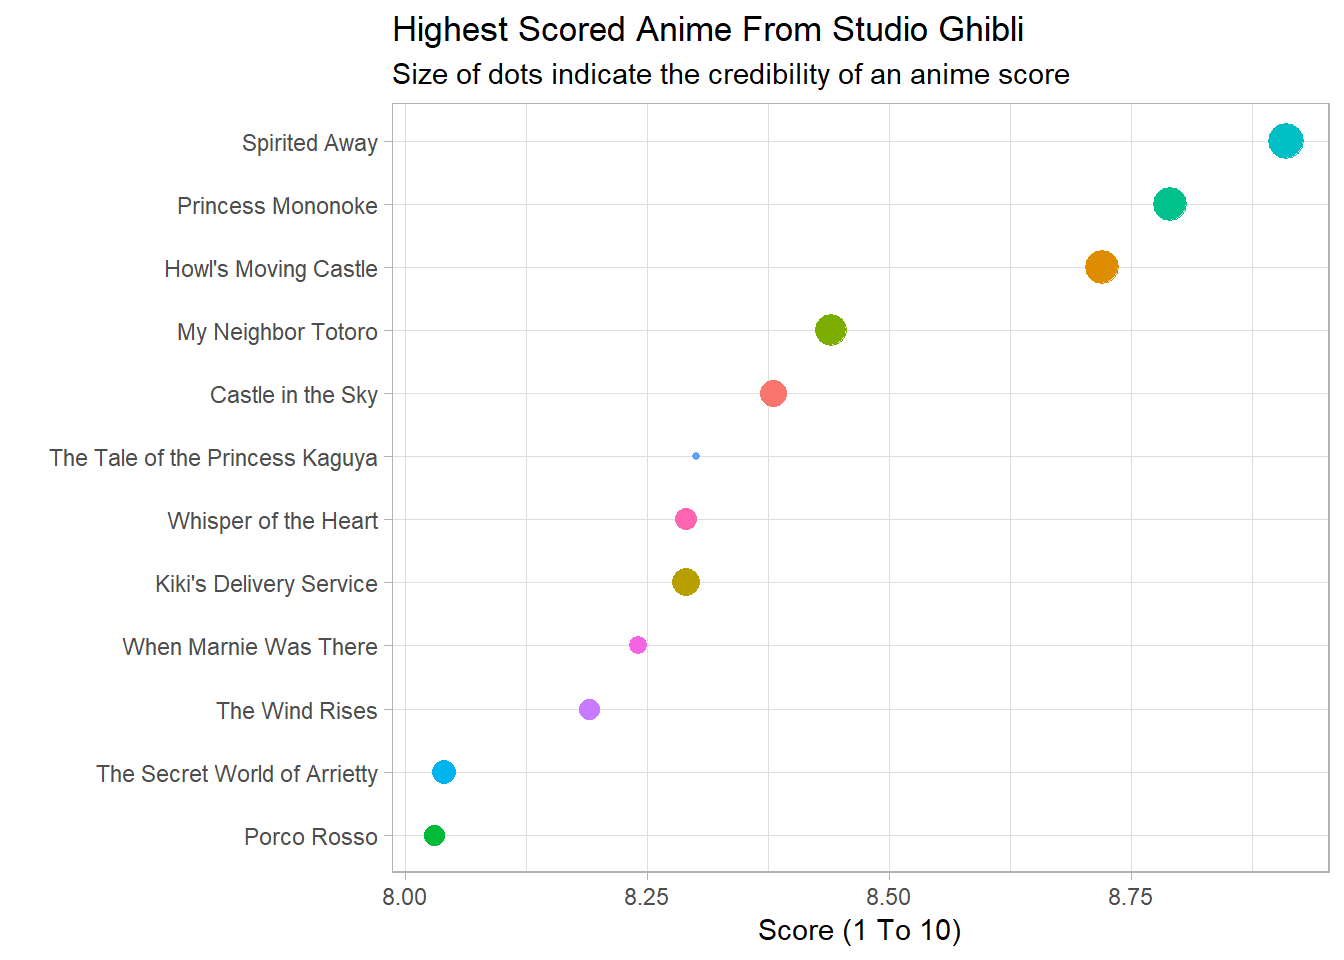
I looked at the trailers of some of these anime, and ‘The Tale of Princess Kaguya’ looks like the best candidate so far. This is despite the fact that its score has less credibility than the others in the above plot.
If she doesn’t like this, then at least we can watch ‘The Red turtle’ together, unless anybody has any other suggestions!